BNSF cites pandemic for revenue drop, but improves operating ratio
Written by Press Release
BNSF will start building a second track in Edmonds, Wash., in 2023.
BNSF
Ed. Note: This is the seventh Q2 2020 earnings report we’ve posted, which covers all seven Class 1 railroads. Links to the earnings of the other six Class 1s can be found below each earnings report. DCL
Volumes and Revenues
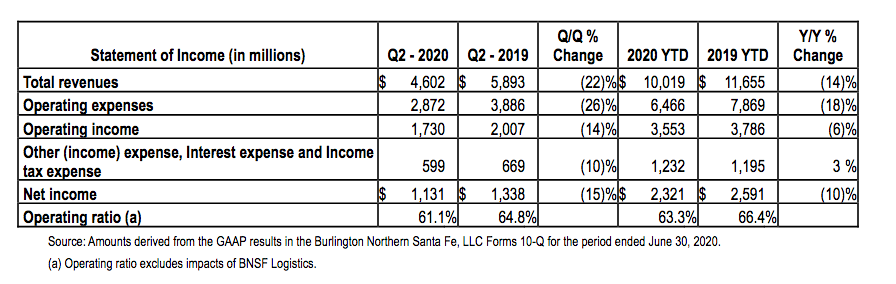
Operating income for the second quarter and first six months of 2020 was $1.7 billion and $3.6 billion, respectively, decreases of $277 million (14%) and $233 million (6%) compared to the same periods in 2019. Operating ratios were 61.1% and 63.3% for the second quarter and first six months, respectively, improvements of 3.7% and 3.1% compared to the same periods in 2019.
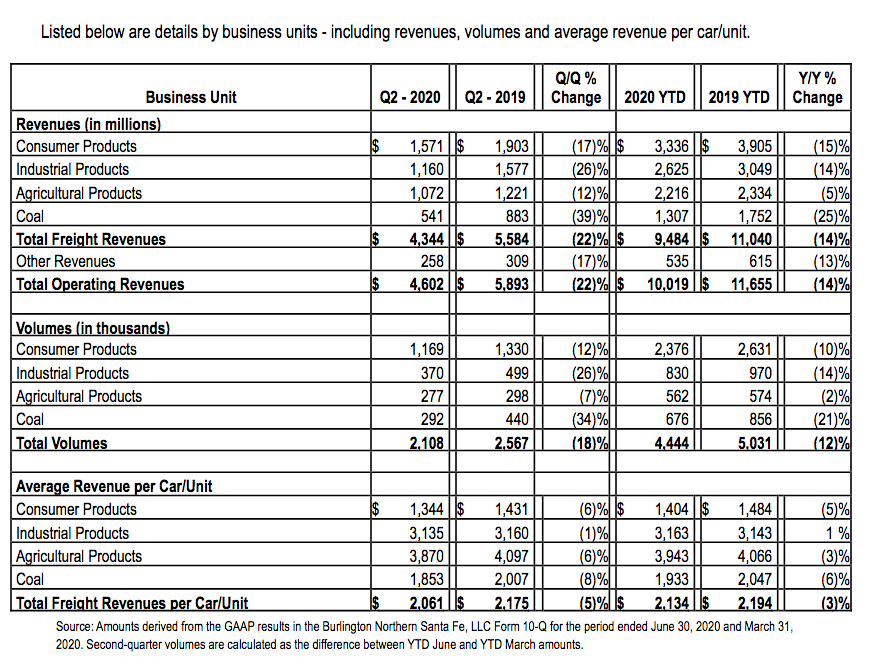
Total revenues for the second quarter of 2020 decreased 22%, while revenues for the first six months of 2020 were down 14% compared with the same periods in 2019. These changes were primarily due to 18% and 12%decreases in unit volume, respectively, for the second quarter and six months of 2020. Additionally, average revenue per car/unit declined 5% in the second quarter and 3% in the second half of 2020 compared to 2019, driven by a one-time favorable outcome of an arbitration hearing recognized in the first quarter of 2019 and lower fuel surcharges. The volume decreases are primarily due to the COVID-19 pandemic, which negatively impacted volumes beginning late in the first quarter and continued through the second quarter. The decrease in volume also resulted from the following:
• Consumer Products volumes decreased 12% and 10%, respectively, for the second quarter and first six months of 2020 compared with the same periods in 2019, primarily due to lower international intermodal and automotive volumes due to the COVID-19 pandemic.
• Industrial Products volumes decreased 26% and 14%, respectively, for the second quarter and first six months of 2020 compared with the same periods in 2019. These changes were primarily due to a decrease in U.S. industrial production driven by the aforementioned pandemic and reduced demand in the energy sector, which drove lower sand and petroleum products volume.
• Agricultural Products volumes decreased 7% and 2%, respectively, for the second quarter and first six months of 2020 compared with the same periods in 2019, primarily due to the impacts of the COVID-19 pandemic on ethanol and related commodities and due to lower net exports.
• Coal volumes decreased 34% and 21%, respectively, for the second quarter and first six months of 2020 compared with the same periods in 2019. These changes were primarily due to lower electricity demand driven by the COVID-19 pandemic and mild winter weather, low natural gas prices and plant retirements.
Expenses
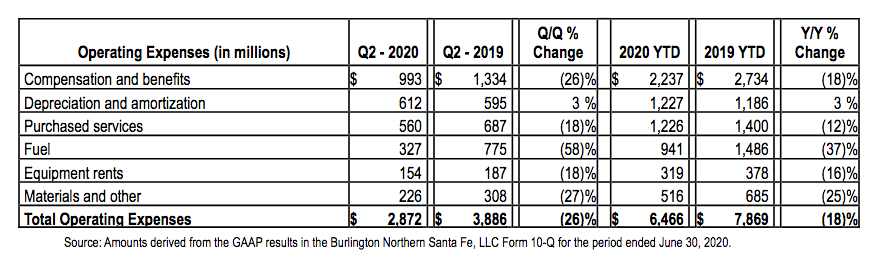
Operating expenses for the second quarter and first six months of 2020 were down 26% and 18%, respectively, compared with the same periods in 2019. The decrease in expenses reflected lower volume-related costs, productivity improvements and lower costs related to improved weather conditions compared to the first half of 2019, including the following changes in expenses
• Compensation and benefits expense decreased 26% and 18% in the second quarter and first six months of 2020, respectively, compared to the same periods in 2019. The decreases were primarily due to lower employee counts associated with lower volume and due to improved productivity.
• Purchased services expense decreased 18% and 12% in the second quarter and first six months of 2020, respectively, compared to the same periods in 2019 due to lower volume and improved productivity, lower purchased transportation costs of our logistics services business, as well as insurance recoveries in 2020 related to 2019 flooding.
• Fuel expense decreased 58% and 37% in the second quarter and first six months of 2020, respectively, compared to the same periods in 2019. The decrease was primarily due to lower average fuel prices, lower volumes and improved efficiency. Locomotive fuel price per gallon decreased 46% and 25% in the second quarter and first six months of 2020, respectively, compared to the same periods in 2019.
• Materials and other expense decreased 27% in the second quarter of 2020 and 25% in the first six months of 2020 compared to the same periods in 2019. The decrease was primarily a result of lower volume-related costs, the effects of cost controls and lower personal injury expense.
• There were no significant changes in depreciation and amortization, equipment rents and interest expense.
Capital Commitments
BNSF has lowered its capital commitments plan for 2020 to $3.1 billion, or $300 million lower than previously announced, given lower volumes being experienced due to the COVID-19 pandemic and productivity improvements. This new level of capital will have a continued emphasis on maintenance and expansion required to continue operating a safe, reliable and efficient network that meets customer demands.
Union Pacific Q2 2020 earnings results
Canadian Pacific Q2 2020 earnings results
Canadian National Q2 2020 earnings results
Norfolk Southern Q2 2020 earnings results
Kansas City Southern Q2 2020 earnings results