BNSF Q3 2020 – revenue and operating ratio both down
Written by David C. Lester, Editor-in-Chief
BNSF
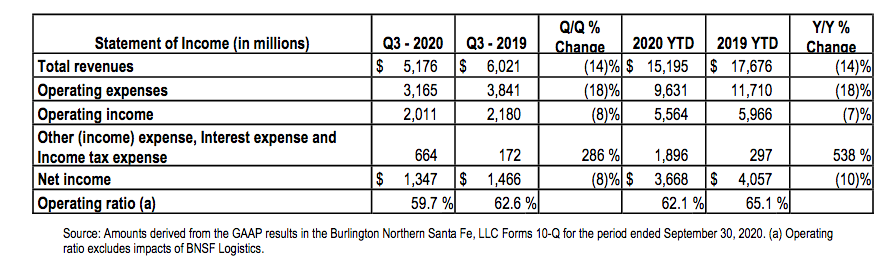
BNSF recently reported its financial results for Q3 2020. Revenue was down 14.4 percent compared to Q3 2019 (bad) and the operating ratio was down to 59.7 percent compared to 62.6 percent in Q3 2019 (good).
Volumes and Revenues
Operating income for the third quarter and first nine months of 2020 was $2.0 billion and $5.6 billion, respectively, decreases of $169 million (8%) and $402 million (7%) compared to the same periods in 2019. Operating ratios were 59.7% and 62.1% for the third quarter and first nine months, respectively, improvements of 2.9% and 3.0% compared to the same periods in 2019.
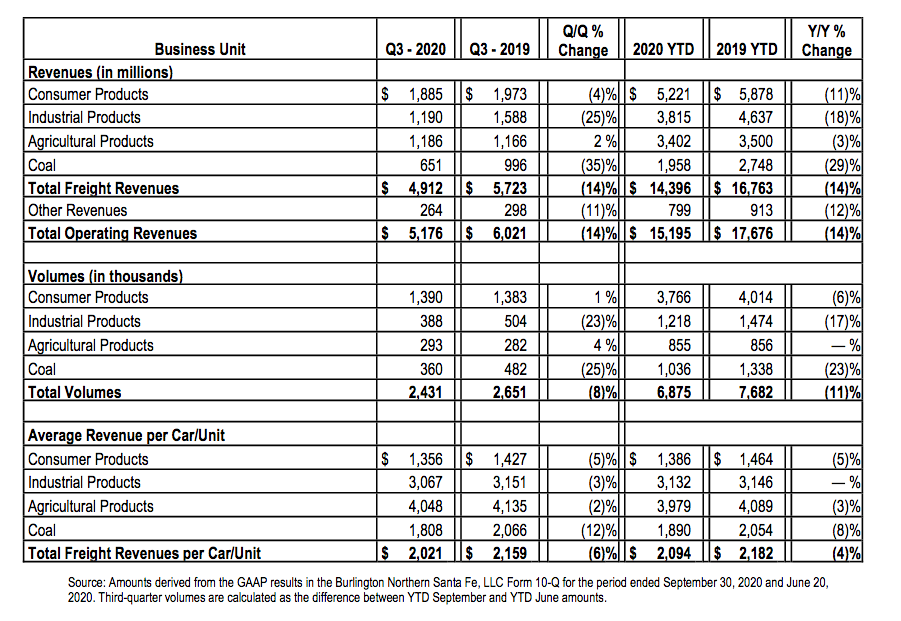
Total revenues for the third quarter and first nine months of 2020 decreased 14% in each period compared with the same periods in 2019. These changes were primarily due to 8% and 11%decreases in unit volume, respectively, for the third quarter and first nine months of 2020. Additionally, average revenue per car/unit declined 6% and 4%, respectively, in the corresponding periods. The volume decreases are primarily due to the COVID-19 pandemic which severely impacted volumes through the first half of the year. Volumes sequentially improved from earlier periods, but continued to be impacted in the third quarter. The decrease in revenue also resulted from the following:
•Consumer Products volumes increased 1% and decreased 6%, respectively, for the third quarter and first nine months of 2020 compared with the same periods in 2019. Increased retail sales and inventory replenishment by retailers, along with increased e-commerce activity offset earlier declines resulting in higher domestic intermodal volumes for the third quarter and the first nine months of 2020. While automotive shipments increased year over year in the third quarter and international intermodal volumes improved from earlier levels, both remain lower for the nine-month period primarily attributable to the COVID-19 pandemic.
•Industrial Products volumes decreased 23% and 17%, respectively, for the third quarter and first nine months of 2020 compared with the same periods in 2019. These changes were primarily due to a decline in U.S. industrial production driven by the aforementioned pandemic and reduced demand in the energy sector, which drove lower sand and petroleum products volume.
•Agricultural Products volumes increased 4% in the third quarter and were about equal in the first nine months of 2020 compared with the same periods in 2019. Higher grain and meal exports in the third quarter were substantially offset by the impacts of the COVID-19 pandemic on volume, primarily ethanol and sweeteners, along with lower soybean exports.
•Coal volumes decreased 25% and 23%, respectively, for the third quarter and first nine months of 2020 compared with the same periods in 2019. These changes were primarily due to lower electricity demand driven by the COVID-19 pandemic and mild winter weather in the first quarter, low natural gas prices, and utility coal plant retirements.
Listed below are details by business units – including revenues, volumes and average revenue per car/unit.
Expenses
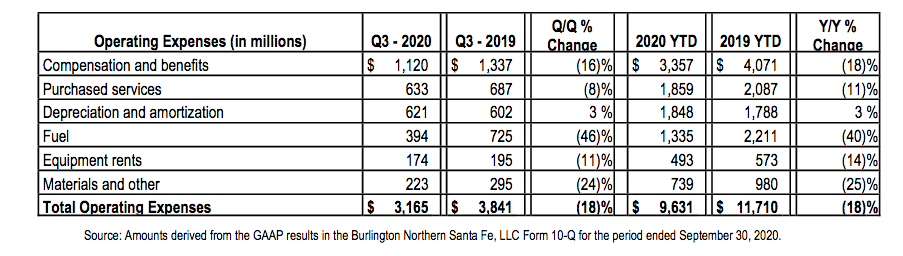
Operating expenses for the third quarter and first nine months of 2020 were down 18% in each period compared to 2019. The decrease in expenses reflected lower volume-related costs, productivity improvements, the effects of cost control initiatives, and lower costs related to improved weather conditions compared to 2019, including the following changes in expenses:
•Compensation and benefits expense decreased 16% and 18% in the third quarter and first nine months of 2020, respectively, compared to the same periods in 2019. The decreases were primarily due to lower employee counts associated with lower volume and due to improved workforce productivity.
•Purchased services expense decreased 8% and 11% in the third quarter and first nine months of 2020, respectively, compared to the same periods in 2019 due to lower volume and improved productivity, lower purchased transportation costs of our logistics services business, as well as insurance recoveries in the first half of 2020 related to network flooding in 2019.
•Fuel expense decreased 46% and 40% in the third quarter and first nine months of 2020, respectively, compared to the same periods in 2019. The decrease was primarily due to lower average fuel prices, lower volumes, and improved fuel efficiency. Locomotive fuel price per gallon decreased 37% and 29% in the third quarter and first nine months of 2020, respectively, compared to the same periods in 2019.
•Materials and other expense decreased 24% in the third quarter of 2020 and 25% in the first nine months of 2020 compared to the same periods in 2019. The decrease was primarily a result of lower volume-related costs, the effects of cost controls, and lower personal injury expense.
•There were no significant changes in depreciation and amortization, equipment rents, and interest expense.
Kansas City Southern Q3 2020 results
Norfolk Southern Q3 2020 results
Canadian National Q3 2020 earnings results
Canadian Pacific Q3 2020 earnings results
Union Pacific Q3 2020 earnings results
Media
RELATED ARTICLES