Patch Rail: Improving the Planning Process
Written by Bob Tuzik, contributor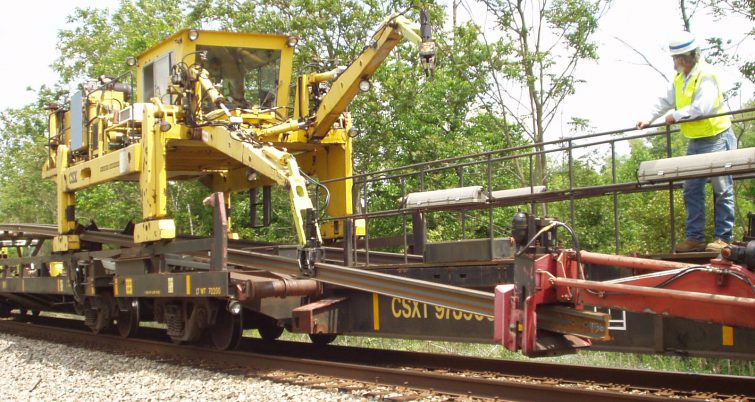
CWR for patch rail programs is unloaded by a gantry crane in one of CSX’s Robel trains.
Planning annual curve rail replacement programs is an essential element of maintenance planning on Class 1 railroads. Every railroad does it, with varying degrees of automation in the planning office and verification in the field.
Until recently, CSX Transportation’s patch rail replacement planning was a manual effort—an annual paper chase fraught with guesswork and assumptions that sometimes led to overspending as planners erred on the conservative side to ensure safety on the system. The approach worked, but it was cumbersome. In order to evaluate the legitimacy of up to 5,000 annual requests for patch rail from the field, the capital planning group had to review data from a variety of sources, including paper notes, emails, spreadsheets, along with data from 14 ultrasonic rail testing trucks and three track geometry cars collecting data on more than 21,000 miles of track. Pulling this disparate data together was a time-consuming job in and of itself. Sometimes there was conflicting information. Sometimes the critical information from the geometry car printouts that were bound in books went missing, or bad data from a recent test replaced good data from the previous test.
“If we didn’t have data to review, I’d have to rely on institutional knowledge and guesswork based on what I know about curvature, speed, tonnage and the age of the rail in a curve, to make a decision,” said Ed Tubbs, director of capital planning for CSX. “Even if I’m 98 percent right, the wrong assumptions still cost money. A potential 2 percent error can cost us $1.5 million a year—money that with no other planning system in place would go unnoticed.”
On average, a wrong decision can cost CSX nearly $80,000 dollars,” said Jennifer Hollar, CSX manager – engineering systems.
“The old way wasn’t a very good process,” Ed Tubbs said. “We had to find something that would work better for us.”
In order to improve the planning process, CSX started by importing rail wear data into Bentley Systems, Inc.’s Optram software, which was already being used to generate track charts across the system. “Then we started brainstorming,” Tubbs said.
After a thorough assessment of its needs, the maintenance planning group determined that it needed a software program that could incorporate measurement data, along with notes, images and requests from the field, all in one place. It also needed a way to differentiate requests that had been reviewed from those pending evaluation.
CSX first tried to develop a program internally. When it became clear that that wasn’t going to work, it approached Bentley to see if they could come up with a solution. One month later, Bentley delivered the OpenRail Operational Analytics (formerly Optram) platform, the tool that the CSX planning group envisioned to overlay requests from the field with rail wear measurement data form the geometry cars, enabling planners to make qualitative assessments and determine which of the thousands of requests for patch rail to include in its annual program.
The last piece of the puzzle was to incorporate a “checkbox” into the OpenRail Operational Analytics system that enables the user to overlay multiple sets of data for any segment for which there is a request for patch rail. The checkbox identifies the requests and curve segments that have been reviewed and/or approved. Whatever is not approved rolls over for consideration in the following year.
“The checkbox allows us to go to the exact location of the requests, so I can see what the field has asked for with multiple layers of data superimposed,” Tubbs said.
In the paper-planning past, mistakes would go unnoticed. The railroad could be spending money two to three years too early. While a 2 percent error doesn’t sound like much, it represents $1.5 million in capital that could be spent on other projects, such as tie, surfacing or out-of-face programs.
“Now, we get it right the first time,” Tubbs said.
In addition to the increased accuracy that it provides, the software, which was first used to support the 2017 patch rail program, reduced the time required for the annual capital planning review by two resource months. More importantly, the software, which is also available to the roadmasters and track supervisors who make the requests and carry out the replacement plan, has provided reassurance that the field and planning groups are in sync, accurately identifying and managing the risks associated with rail wear and defects.
The project has been so effective that it was recognized as the project of the year in the Road and Rail Asset Performance Category at Bentley’s 2018 The Year in Infrastructure Awards. One of the jurors who considered the scope of the project, the ROI, and the impact it had on the organization, characterized it as “a simple solution that had a massive impact on efficiency, a relatively low cost to implement, which resulted in millions being saved, and one that CSX plans to expand to other areas as a result of the program’s success,” said Meg Davis, Senior product marketing manager in Bentley’s AssetWise Road and Rail group.
“CSX had a clear sense of what they wanted and were able to articulate it so that the developers could deliver it,” Davis said.
How the System Works
The patch rail planning process, which includes curves and short tangents between curves, begins with requests for rail from the field. Field personnel use an internal application to file their requests for rail. That information is loaded weekly into the Optram / OpenRail Operational Analytics system. From there, it is overlaid with data from the geometry cars and internal defect information that is collected by ultrasonic rail flaw detection cars that cover the network.
Planning consists of two components: the “potential” plan, which consists of requests from the field, and the “actual” plan, which represents the projects that are approved by Ed Tubbs and the rail planning group. Once the data is in the software, Tubbs and the planning staff review every request overlaid with the geometry car data for that segment. While there is no cap on spending to execute the patch rail replacement program, CSX endeavors to spend every dollar wisely.
“In 2018, less than a third of the jobs that were submitted made it into the actual plan,” CSX’s Jennifer Hollar said.
“We have to be careful how we allocate funds,” Tubbs said. Field forces are known to do everything they can to get their projects approved. This includes cherry picking information that puts their requests for rail in the most favorable light. They may, for example, send photos of rail worn to or near its condemning limits. What they may not say, however, is that that information represents 50 feet of data from the worst spot in a 2,000-foot curve.
“It’s our job to catch that,” Tubbs said. “A case like this may only require a 50-foot plug, rather than replacement of the entire curve.”
The 3,083 requests for patch rail in the 2018 program represented 936 linear miles of track at a cost of $251 million. After careful review and analysis CSX approved 1,020 jobs representing 272 linear miles at a cost of $73 million. Any request that was not approved automatically rolls to the following year for re-review.
With the Optram/ OpenRail Operational Analytics program, CSX can overlay measurement data against requests from the field to determine if the requests are legitimate. In some instances, the number of defects in a curve can dictate replacement, regardless of how much or how little the rail is worn.
“We’ll flag any curve that has three defects or more, especially short curves, but we also look at the age of the rail, tonnage, and the type and size of the defects,” Tubbs said. “Some defects are more critical than others. An engine burn, for example, is not indicative of rail fatigue, so it’s not as important as a vertical split head on rail that’s approaching the condemnable limits on a heavy tonnage line.”
But if Tubbs sees near-condemnable rail wear in conjunction with rail defects, or rail defects that are clustered, he’ll plan to take them out of track. “I’m not going to leave anything risky in there that could lead to a derailment,” he said
Tubbs and the planning group also look beyond the requests and perform an overall network analysis to see if there’s anything that should come out of track that was not requested Then we’ll approve any addition work—based on risk—that the field has neglected to submit.
The patch rail program does not have a cap, per se. It’s based on the risk assessment that comes from measurement data and field assessments. But If approvals for patch rail exceed the annual budget, adjustments are made to other programs, such as ties or surfacing programs.
Once it began using the software, CSX determined that while the tabular and strip chart views the software provided effectively organized the confluence of information, something was still missing. With multiple users of the software and new data uploaded weekly basis, it was hard for users to tell which requests had been reviewed and whether they have or have not been approved. “Most importantly, we needed the program to update our internal capital planning application. And, the integration needed to be seamless to the user,” Jennifer Hollar said.
That drove CSX and Bentley to come up with a “checkbox” system that clearly identifies which of the patch rail requests have been reviewed and which have been approved. “Once we have viewed all the data elements, we click the magic checkbox to access our capital planning application within CSX’s Technology Engineering software,” said Hollar, who also serves as the liaison between the Bentley enterprise application and the CSX Engineering Asset and Track Data Information applications.
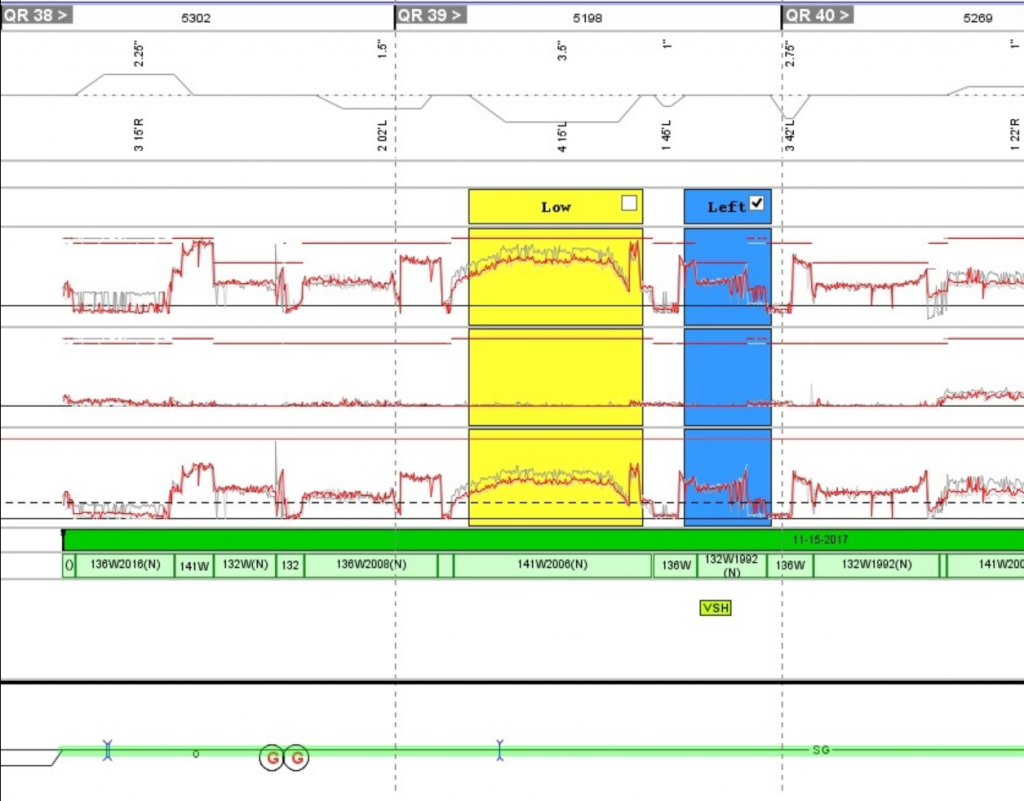
The Optram / OpenRail Operational Analytics system helps planners visualize multiple data sets and requests from the field for curve patch rail. Multiple layers of rail wear, geometry and rail defect data are superimposed over segments at which field personnel have requested patch rail. The yellow highlight shown in the screenshot indicates a patch rail request that has not yet been approved. The blue highlight indicates that the request has been approved.
“The two systems talk to each other so seamlessly that you’d never know that you’re running two systems,” Tubbs added.
The Optram / OpenRail Operational Analytics program provides a user interface that’s quick and easy to use, Hollar said. Several people can work within the program at the same time to review different patch rail requests. Initially, two planning people were required to manage the patch rail program. “With the software, Ed can manage the patch rail program on his own and the other person can devote his efforts to out-of-face work,” she said.
The software has proved such an effective tool to manage the patch rail program that CSX plans to begin using it to plan re-gauging work and tie pad repair/replacement on concrete ties.
“This is the perfect system for us. It’s exactly what we need,” Tubbs said. “I wouldn’t change a thing.”