Research: Bridge Asset Management and the Degradation Model
Written by Avinash Prasad and Ms. Purnima Prasad
Amtrak
Editor’s Note: From time to time we will publish cutting-edge research in the world of railroad engineering. In this piece, researchers look at the use of the degradation model in bridge asset management.
Abstract: Data Driven Predictive Analytics for Bridge Asset Management is normally used for suitable repair and or rehabilitation plan of a typical bridge system based on the development of degradation model. Bridges would be showing signs of distress due to aging, improper repair, rehabilitation, or lack of proper maintenance. There is a wide research gap in bridge asset management particularly in the field of proper structural evaluation of bridges. Extending the useful service life of aging bridges is very important for the transportation industry. One of the problems faced by the US transportation industry is the degradation of structural components of highway bridges (normal deterioration and natural disasters like Hurricane Sandy etc.). The main reason behind these problems is the over usage of highway bridges beyond their useful service life in association with improper bridge asset management. The structural evaluation of the bridges is mostly done visually which varies in interpretation based on the judgement of the inspector (structure evaluator). In degradation model analysis, failure can be directly related to a change over time in a measurable structural parameter. This opens up the possibility of measuring degradation over time and using those data to extrapolate when failure will occur. This approach would allow us to fit acceleration models and life distribution models without actually waiting for failures to occur. In this analysis, various structural parameters, which drift monotonically (upwards, or downwards), can be measured over time towards a specified critical value corresponding to their failure stage. The aim is to fit models using degradation data instead of failures. The degradation model will be multidimensional, incorporating infrastructure element type, exposure, and time.
Introduction: Extending the useful service life of aging bridges is a critical issue of national interest. One of the problems faced by the US transportation industry is the degradation of structural components of highway bridges. Examples of this include effect of aging on performance subject to normal service conditions and extreme events (natural disasters or human induced). It is very important for the transportation industry to extend the service life of aging bridges. Structural failure of a bridge may be a combination of poor design, construction, maintenance, failure to inspect fracture critical and fatigue prone details thoroughly, severe weather conditions, and/or a combination of all these factors.
For early warnings on structural damage, deterioration before costly maintenance repair, or even before unexpected collapses occur, bridge engineering is equipped with structural health monitoring technologies (Brownjohn, 2007). Probabilistic and statistical concepts for bridge performance prediction are used in the application of bridge health monitoring (BHM). Repair actions are generally used to prevent failures and to maintain or extend the lifetime of deteriorating structures. To establish optimum inspection/repair planning for a structure, the structure’s performance under uncertainty should be assessed and predicted using probabilistic concepts and methods (Frangopol and Tsompanakis, 2014). Current bridge management systems use deterministic, Markov chain, or the semi-Markov process to predict a structure’s future performance and service life (Maguire, 2014). Many states have successfully developed deterioration models for their inventory. The semi-Markov process can be used in load rating-based bridge deterioration modelling for bridge asset management. It is observed that the Weibull-based approach performs better in terms of the observed conditions than the traditionally used Markov chains approach for developing deterioration curves for different bridge elements (Agarwal, Kawaguchi and Chen 2010).
With some exceptions, the structural evaluation of the bridges is carried out visually (Prasad, 2013). Mandated by the federal government, all highway bridges are subject to biannual inspection (New York State Department of Transportation Office of Structures, 2017). Results of visual and machine aided inspection procedures are then compiled and analyzed for further action, and it ranges from routine maintenance to bridge closure in extreme scenarios. The aim of this research project, is to carry out a data driven analysis of bridge inspection records in order to advance the optimization of bridge preventive maintenance. This will be carried using statistical and machine learning procedures toward the development of deterministic and/or probabilistic deterioration models for bridges based on historical and geometric data.
Current Procedure for Structural Evaluation and Rating of Bridges:
The following formulation, shown below in Equation 1, is used in calculating the Weighted Condition Rating of a Bridge as a whole (Yanev, 2007).
![]()
Where Ri = Lowest Condition Rating of Element i on the bridge and Wi=Weight assigned to Element i
The following Table 1 (shown below) expresses bridge element and their corresponding weights in calculating the Weighted Condition Rating of a Bridge as a whole (Yanev, 2007).
Table 1: Elements and Weights in the NYS DOT bridge Condition Formula
| Element (i) | Weight (Wi) | |
| 1 | Bearings, anchor bolts, pads | 6 |
| 2 | Backwalls | 5 |
| 3 | Abutments | 8 |
| 4 | Wingwalls | 5 |
| 5 | Seats | 6 |
| 6 | Primary Member | 10 |
| 7 | Secondary Member | 5 |
| 8 | Curb | 1 |
| 9 | Side-Walk | 2 |
| 10 | Deck | 8 |
| 11 | Wearing Surface | 4 |
| 12 | Pier | 8 |
| 13 | Joint | 4 |
| SUM | 72 |
The Condition Rating Scale used by NYDOT for Bridge Inspection (New York State Department of Transportation Office of Structures, 2017) is expressed as:
- Totally deteriorated, or in failed condition
- Used to shade between ratings of 1 and 3
- Serious deterioration, or not functioning as originally designed
- Used to shade between ratings of 3 and 5
- Minor deterioration, but functioning as originally designed
- Used to shade between ratings of 5 and 7
- New condition
- Condition and/or existence unknown.
- Not applicable.
The General Recommendation should not be lower than the lowest of the individually rated elements. A General Recommendation must be provided for every general bridge inspection. Ratings of 8 (not applicable) and 9 (unknown) are never acceptable as a General Recommendation.
There are various categories for the inspection of bridges (New York State Department of Transportation Office of Structures, 2017). These categories include a biennial inspection, an interim inspection, an in-depth inspection and a special inspection.
A biennial inspection is the most common type of inspection required for all highway bridges. It takes place at least once every two years. All new bridges, reconstructed bridges, and rehabilitated bridg receive a biennial inspection within 60 days of formal project acceptance or after it has been fully opened to traffic.
An interim inspection is performed when one or more of the following conditions exist. These conditions include: bridge is posted for load capacity below the state unrestricted legal load limit, a General Recommendation of 3 or less is present, and the presence of any active/inactive red flag or an active yellow flag.
An in-depth inspection is a comprehensive detailed inspection of the entire bridge, and it frequently incorporates destructive and non-destructive inspection techniques. It is more complete and more intensive than a general inspection. In-depth inspections are performed on an “as needed” basis to assist in making bridge rehabilitation versus replacement decisions.
A special inspection is an unique inspection targeted towards special situations or conditions. A special inspection is performed whenever the structural integrity of a bridge is or has been compromised by a storm, flood, natural phenomenon, accident, or manmade occurrence.
Flags are an alternative means for expressing a structural condition. A flag is used to report conditions posing a clear and present danger or a condition which would likely become a clear and present danger if left unattended for an extended period of time. There are various types of flags like a red flag, a yellow flag and a safety flag.
A red structural flag is used to report the failure or potential failure of a primary structural component that is likely to occur before the next scheduled biennial inspection. An yellow structural flag is used to report a potentially hazardous structural condition which, if left unattended, could become a clear and present danger before the next scheduled biennial inspection. A safety flag is used to report a condition that is presenting a clear danger to vehicular or pedestrian traffic, but poses no danger of structural failure or collapse. A Prompt Interim Action (PIA) is issued/recommended when a red flag or safety flag condition is considered extremely serious and is in need of immediate attention.
Prior Work in Degradation Modeling:
Dr. Bojidar Yanev had worked on the development of a bridge degradation model, a flag forecasting, and a correlation between bridge condition rating and flags. (Yanev, 2007). Between 1980 to 1994, the New York State Department of Transportation’s (NYCDOT’s) 800 bridge flags were reported on annual basis. The initial number of flags reported was 78 in 1982 which swelled to 3220 in 1995. The flag data issued for NYCDOT Bridges from 1982 to 2000 was used for flag forecasting. The main reason behind this escalation of flags numbering was based on the fact that half of NYCDOT bridges were more than 30 years old at that time and preventive maintenance of these bridges were postponed for want of funding. The incidents of bridge structural failure because of improper inspection of fracture critical and fatigue prone details and safety issues on account of loose concrete underneath bridge decks, increased the number of flags (Yanev, 2007).
The number of flags issued for twenty-two bridge elements in selected years (1982, 1987, 1988, 1989, 1990 and 1991 projected) was used in developing the formulation for flag projection and bridge condition rating (Yanev, 2007). Specifically, these twenty-two bridge elements were the abutment joint, abutment bearings, abutment seat, abutment stem, backwall, wingwalls, approach guide rail, wearing surface, curbs, sidewalk, railing, scuppers, median, deck, primary member, pier joints, pier bearings, pier pedestals, pier stem, cap beam, columns and utilities. These twenty-two bridge elements accounted for 85% of the flags issued. The twelve bridge elements (abutment joint, abutment bearings, abutment stem, backwall, approach guide rail, wearing surface, sidewalk, railing, deck, primary member, columns, and utilities) accounted for 70% of the flags and the rest ten bridge elements (abutment stem, wingwalls, curbs, scuppers, median, pier joints, pier bearings, pier pedestals, pier stem and cap beam) accounted for 15% of the flags. The method used was purely deterministic and was less reliable since the bridge condition historical data of only selected years were used. It was observed that a lower primary bridge element rating corresponds to a higher number of flags. Also, the flag and the bridge condition data automatically cannot be linked to each other based on the structural evaluation system followed. The cross referencing between flag and bridge condition rating has to be made manually.
Based on the past records and trends, the procedure assigned a ratio of flagged elements to every condition rating level of the bridge’s twenty-two elements. The result was assumed to represent roughly 85% of all the anticipated flags.
The following formulation, shown below in Equation 2, is used in creating correlation between flags and bridge ratings (Yanev, 2007).
![]()
The prior work done by Dr. Bojidar Yanev on the bridge degradation model, flag forecasting and the correlation between bridge condition rating and flags can be further researched /extended to carry out a data driven analysis of bridge inspection record in order to advance the optimization of bridge preventive maintenance. This will be carried out using statistical and machine learning procedures toward the development of deterministic and/or probabilistic deterioration models for bridges based on historical and geometric data.
Concept of Degradation Model:
A degradation model is used for bridge asset management. In this analysis, the nondestructive degradation model is referenced. “Normally the degradation of a typical bridge is limited to New York State (NYS) condition rating of 3 (poor condition)” in itself is not true. In general, when the degradation of a typical bridge NYS condition rating falls below 3, emergency repair and/or rehabilitation kicks in, unless the bridge fails due to a natural or manmade hazard. Extrapolation of degradation data is made towards the failure stage. In degradation model analysis, tendency for failure can be related to a change of observed conditions over time (Fitting Models Using Degradation Data Instead of Failures, 2017). In the case of bridges, structural parameters, which vary monotonically, can be measured over time toward a limit state of serviceability. The aim of the proposed research is to develop models using inspection data that incorporates the infrastructure element type, the exposure, and the time.
A parameter D, which can be measured over time, drifts monotonically upwards or downwards towards a specified critical value. When it attains that specified critical value, failure occurs. Often, the degradation lines go through the origin when the percent change is the measurable parameter increasing towards failure level. Degradation may not proceed in a smooth, linear fashion towards what the customer calls “failure”. A simple approach is to extend each unit’s degradation line until a projected “failure time” is obtained. Using all the degradation readings and linear regression, models can be fitted.
The drift (D) slope (rate of degradation) is assumed linear over time. In order to attain the linearity of the function, logarithmic or power functions may need to be used. The larger the data set, the more realistic the degradation model will be (Fitting Models Using Degradation Data Instead of Failures, 2017).
Development of deterioration models will happen after the collection of data and the determination of the important factors affecting deterioration. Linear regression techniques can be used to identify parameters that are affecting the deterioration of various bridge components (Maguire, 2014). Deterministic and/or stochastic condition models can be developed for bridge asset management.
- Deterministic models are depended on the mathematical or statistical formula for a relationship between factors affecting the bridge condition (Hatami and Morcous, 2012). Using single or multi-variable regression, the proposed deterministic models will be developed to determine the goodness of fit to some number of explanatory variables, as determined from several analyses. In general, deterministic methods predictions are better for short-term than long term.
- Stochastic models used for infrastructure deterioration is based on the Markov decision process. The bridge conditions will be defined as different Markovian states, in which there is a probability of the bridge element deteriorating from one state to another. After compiling these probabilities into a transition matrix, the bridge data can be inserted into the bridge management system or a custom system.
The Following are The Basic Statement of Work:
- Development of a data driven degradation model (deterministic and/or stochastic) of bridges is proposed based on historical data (Flags, Condition Rating) of selected clusters of bridges, as identified by their attributes, main components, design, operational and degradation parameters. The various bridge degradation model attributes are bridge ID, bridge group ID, bridge opening date, bridge width, bridge span, bridge material, bridge failure/discontinuance date, bridge network ID, bridge network name, bridge “failure/discontinuance” start date, bridge “failure/discontinuance” end date etc.
- The developed deterministic and/or probabilistic degradation model(s) of the selected bridge systems can be used for both flag prediction and the development of a correlation between flags-condition rating for future repair and/or rehabilitation.
- The degradation model will be analyzed/investigated and tested with regard to a gradual aging effect filtering abrupt rise or fall in the bridge condition rating. The abrupt rise in bridge condition rating, followed by a slow rate of degradation, could be due to major repair and/or rehabilitation. The abrupt drop in condition rating, followed by a fast rate of degradation, could be due to a failure induced by a catastrophe event or an inherent design flaw.
Modeling Tools:
“Cemagref-Sciences, water & territories” developed the software “Casses.” Casses” is an asset management software that was originally developed for the prediction of breaks in water supply networks. This software will be used in the initial phase of model development for bridge asset management. There are two versions of the software “Casses”: “Casses-Mono” and “Casses-Multi”. The imported files are of text csv (Comma-separated values) format with the semicolon (;) as the data separator. For both versions of “Casses”, these two files are at least necessary which are – The bridge file and the breaks file. For “Casses-Multi”, an additional file is needed, and this file is the bridge networks file. This program is used for asset management of deteriorated pipe systems with multiple attributes. There is planning to use this program for developing the multi-dimensional bridge degradation model to correlate multiple attributes (Various bridge degradation elements, degradation parameters and time). This software can be launched in various languages including German, French, and English (Casses Software Version 2.0.0 User Manual, 2010).
“Casses” software is based on an expanded and developed multi-factor Poisson distribution named Linear Extension of the Yule Process (LEYP)”. Recurrent event modeling is based on the Yule process (Renaud, Le Gat and Poulton, 2012; Le Gat, 2016).
The probability mass function of the Poisson distribution with mean (λ) is given by Equation 3 shown below:
![]()
The Linear Extension of the Yule Process (LEYP) calibration model carries out statistical tests to check the significance of the model parameters. The standard test for significance is an approximate chi-squared valid test that provides a p-value for each model’s parameters. If the p-value is less than 0.05 then, the parameter is considered significant and should be retained.
Poisson regression is a form of a generalized linear model in which the response variable is modeled as having a Poisson distribution. For large means, the Poisson distribution is well approximated by the normal distribution. The Poisson distribution is often used to model rare events.
The basic principle of the validation is to compare the bridge deterioration prediction with the actual deterioration for a period when breaks were observed. To perform the validation, two distinct periods are defined from the bridge deterioration recording period- a calibration period and a subsequent validation period. There is a factor (Rn) in the program which is defined as ratio between the number of predicted and actual bridge deterioration for all the bridges during the validation period. The prediction is more satisfying when Rn is close to one (Casses Software Version 2.0.0 User Manual, 2010).
Customized software for predictive analytics may follow depending on the initial results using “Casses”. In this dissertation, “Cemagref- Sciences, eauex & territories” developed the software “Casses”, and it is used for bridge asset management (Casses Software Version 2.0.0 User Manual, 2010). Other statistical and machine learning procedures can be used (if required) toward the development of deterministic and/or probabilistic deterioration models for the NYCDOT bridges based on historical and geometric data.
Research Methodology & Process Architecture:
STEP 1: Identification/Selection of cluster of bridges.
STEP 2: Identification of Primary/Controlling members (Main Girders, Piers/Abutments, Deck, Bearing) of Reinforced Concrete Bridges which controls the Overall Rating (Health) of the Bridge Structure.
STEP 3: Data Analysis-Primary Member Degradation with Reference Relevant indicators (Crack, Corrosion, Section Loss, Seepage etc.)
STEP 4: Identification of Condition Rating level (Severe, High, Medium, Low, Insignificant) based current Industry Practice-Indicator- CRACK
STEP 5: Risk Matrix with Risk Rating- Indicator- CRACK
Repeat STEP 4 and 5 For Other Indicators (Corrosion, Section Loss, Seepage etc.)
STEP 6: Following current inspection practice or standards, Establish the overall Risk Rating of the primary bridge component as weighted risk severity by assigning a weight factor for rating of each indicator (Crack, Corrosion, Section Loss etc.)
STEP 7: Repeat STEP #6 for all Bridge Components.
STEP 8: Calculate the Overall Risk Rating (and Finally – Overall Condition Rating) of the Bridge.
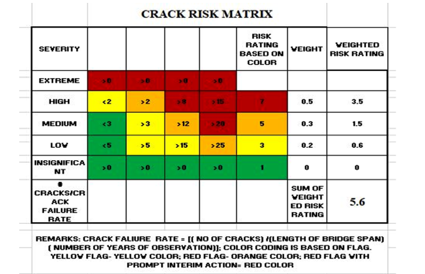
Bridge Risk Matrix:
Figure 1, shown below, is an example of a sample bridge risk matrix. This formulation is based on identification of Condition Rating level (Severe, High, Medium, Low, Insignificant) based current industry practice for indicator- “Crack”.
Input / Output:
The input of the “Casses” software consists of majority portion of available degradation data that can be used to create multiple degradation models. The logic behind inputting the majority portion of available degradation data to the “Casses” program is to create a more realistic degradation model.
The output of the “Casses” software consists of multiple validated degradation models that can be used to predict the structural conditions of bridges in the future. These developed degradation models are validated using the left-over portion of available degradation data. These data driven degradation (deterministic and or stochastic) models of bridges are based on historical bridge data
- Flag forecasting and correlation between flags-condition rating of bridge elements will be developed using the historical data (Flags, Condition Rating) of bridges. The twenty-two bridge elements are abutment joint, abutment bearings, abutment seat, abutment stem, backwall, wingwalls, approach guide rail, wearing surface, curbs, sidewalk, railing, scuppers, median, deck, primary member, pier joints, pier bearings, pier pedestals, pier stem, cap beam, columns and utilities.
- A detailed degradation model analysis report will be developed for an abrupt rise in condition rating, followed by a slow rate of degradation, and an abrupt drop in condition rating, followed by steep rate of deterioration. The abrupt rise in bridge condition rating, followed by a slow rate of degradation, could be due to major repair and/or rehabilitation. The abrupt drop in condition rating, followed by a fast rate of degradation, could be due to a failure induced by a catastrophe event or an inherent design flaw.
Future Work for Data Driven Predictive Analytics for Bridge Asset Management:
With the increasing pace of changes in the technology and the current economic down turn, organizations around the world are focused more on cost-effective and value-added technology/research in the field of advancement of bridge asset management. Stochastic data analysis will be used with the time series of the degradation data (indicators) for forecasting the future development of the degradation indicators. The statistical and stochastic data analysis of the time series of the degradation indicators will be used in predictive analytics to assess maintenance delay impact for prioritization of bridge asset management. The authors are continuing their research on this topic to explore additional facts, which will be published in the future when available.
Authors:
Avinash Prasad, Fellow ASCE, NYU PhD Candidate, PE, PLS, MSCE, MSEM, FF, EMT; and Ms. Purnima Prasad, NYU UG Engineering Student, M.ASCE, M.AICHE, M.AREMA, M.SWE, M.ASQ
Acknowledgements:
My special thanks go to NYU Professor Dr. Ilan Juran for his guidance in the development of this paper and Mrs. Indira for proof reading this paper.
Disclaimer:
Any opinions, findings and conclusions or recommendations expressed in this material do not reflect the views or policies of MTA-NYCT/BT nor do mention of trade names, commercial product or organizations imply endorsement by MTA-NYCT/BT. MTA-NYCT/BT assumes no liability for the content or the use of the materials contained in this document. The authors make no warranties and/or representation regarding the correctness, accuracy and or reliability of the content and/or other material in the paper. The contents of this file are provided on an “as is” basis and without warranties of any kind, are either expressed or implied. The contents of this report reflect the views of the authors who are responsible for the facts and the accuracy of the data presented herein. This report does not constitute a standard, specification, or regulation.
References:
Agarwal, A., Kawaguchi, A. and Chen, Z. (2010). Deterioration Rates of Typical Bridge Elements in New York. Journal of Bridge Engineering, [online] 15(4), pp.419-429. Available at: http://ascelibrary.org/doi/abs/10.1061/%28ASCE%29BE.1943-5592.0000123 [Accessed 8 Jun. 2017].
Brownjohn, J. (2007). Structural Health Monitoring of Civil Infrastructure. Philosophical Transactions of the Royal Society A: Mathematical, Physical and Engineering Sciences, [online] 365(1851), pp.589-622. Available at: http://rsta.royalsocietypublishing.org/content/365/1851/589 [Accessed 10 Jul. 2017].
Casses Software Version 2.0.0 User Manual. (2010). [PDF] pp.1-83. Available at: https://casses.irstea.fr/wp-content/uploads/2013/02/CassesManual_2.0.0_b.pdf [Accessed 19 May 2017].
Fitting Models Using Degradation Data Instead of Failures. (2018). Fitting Models Using Degradation Data Instead of Failures. [online] Available at: https://www.itl.nist.gov/div898/handbook/apr/section4/apr423.htm [Accessed 6 Jan. 2019].
Frangopol, D. and Tsompanakis, Y. (2014). Maintenance and Safety of Aging Infrastructure. 1st ed. pp.685-705.
Hatami, A. and Morcous, G. (2012). Deterioration Models for Life-Cycle Cost Analysis of Bridge Decks in Nebraska. Transportation Research Record: Journal of the Transportation Research Board, [online] 2313, pp.3-11. Available at: http://trrjournalonline.trb.org/doi/abs/10.3141/2313-01 [Accessed 1 May 2017].
Le Gat, Y. (2016). Recurrent Event Modeling Based on the Yule Process. Hoboken: Wiley-ISTE [Imprint], pp.51-65.
Maguire, M. (2014). Developing Wyoming Specific Bridge Deterioration Models for Bridge Management. [PDF] pp.1-11. Available at: http://www.dot.state.wy.us/files/live/sites/wydot/files/shared/Planning/Research/RS04214%20Bridge%20Deterioration.pdf [Accessed 17 Jul. 2017].
New York State Department of Transportation Office of Structures (2017). Bridge Inspection Manual. New York State Department of Transportation Office of Structures, pp.1-328.
Prasad, A. (2013). Suspension Bridges: Concepts and Various Innovative Techniques of Structural Evaluation. RT&S, [online] pp.33-35. Available at: https://www.rtands.com/index.php/track-structure/bridge-retaining-walls/suspension-bridges-concepts-and-various-innovative-techniques-of-structural-evaluation.html [Accessed 12 Mar. 2017].
Renaud, E., Le Gat, Y. and Poulton, M. (2012). Using a Break Prediction Model for Drinking Water Networks Asset Management: From Research to Practice. Water Science & Technology: Water Supply, [online] 12(5). Available at: https://www.researchgate.net/publication/275782901_Using_a_break_prediction_model_for_drinking_water_networks_asset_management_From_research_to_practice [Accessed 6 Jun. 2017].
Yanev, B. (2007). Bridge Management. Hoboken: John Wiley & Sons.
For more research of interest to railroad engineers, take a look at this piece on Weibull Defects Analysis.
Media
RELATED ARTICLES