What are we watching? Preventing railroad trespassing with video
Written by Administrator
Recent research used video in an effort to prevent trespassing on railroad tracks.
Trespassing is the leading cause of rail-related deaths in the U.S. Addressing trespassing along railroad rights-of-way (ROW) is a leading priority for the Federal Railroad Administration (FRA).
On Feb. 19, 2019, the FRA issued to Congress the first National Strategy to Prevent Trespassing on Railroad Property. The report acknowledged that more people are struck and killed by trains each year while trespassing than in motor vehicle collisions with trains at highway rail crossings, and further emphasized that the number of trespassing events each year exceeds the number of fatalities and injuries. This report recognized that previous FRA trespassing prevention programs have not been national in scope or proactive to address the root causes of trespassing. The national strategy includes four focus areas: data gathering and analysis, community site visits, funding, and partnerships with stakeholders. Data gathering and analysis involves review of trespass incidents and close calls to enable the FRA to target its resources to trespassing hot spots. The collection and analysis of quantitative event-based data is an important element for achieving this goal.
The Institute for Transportation Research and Education (ITRE) at NC State University is involved in ongoing research funded by the North Carolina Department of Transportation (NCDOT) that seeks to develop a more complete understanding of the extent of pedestrian trespassing along the railroad network in North Carolina. This research has two major components that seek to better quantify and describe the universe of trespassing activities including those events that do not result in injury or death:
Development and testing of a static (fixed base) thermal camera system at a sample of trespassing hot spots along railroad corridors to determine a count of trespassing events for the data collection time periods and an estimate of the trespassing frequency at the hot spots which can be used to model trespassing across the railroad network; and
Development and testing of a dynamic camera system for detecting trespassing events, including near-strike events, from a moving locomotive.
According to the FRA
The FRA is the primary source for data related to the injury or death of trespassers on the railroad ROW in the U.S. Under Title 49 Code of Federal Regulations (CFR) Part 225, railroad carriers are required to provide the FRA with accurate information concerning the hazards and risks that exist on railroads in the U.S. so that the FRA can effectively carry out its regulatory and enforcement responsibilities under the federal railroad safety statutes. Railroads are required to complete reports and records of accident/incidents in accordance with the current FRA Guide for Preparing Accident/Incident Reports.
According to the FRA guide, the following definitions are used in reference to trespassing:
Trespass: Any vehicle or pedestrian is deemed by the FRA to be trespassing if they are on the part of railroad property used in railroad operation and whose presence is prohibited, forbidden, or unlawful, including if:
They are in the railroad ROW not at a designated crossing; and
They are in the railroad ROW at a designated crossing when the gates are down.
Trespass incident: A trespasser is struck or otherwise injured by rail equipment, resulting in a form being submitted to the FRA.
While FRA incident reporting potentially provides a near-census of trespasser casualties on railroad ROW, the dataset does not capture the universe of trespassing activities including those events that do not result in injury or death. ITRE’s research in North Carolina attempts to address this gap by developing a scientific data collection strategy and analysis approach to better understand pedestrian trespassing along railroad ROW in the state.
Through the use of video
The first component of the research involved thermal video data collection at a sample of trespassing hot spots along the railroad network in North Carolina.
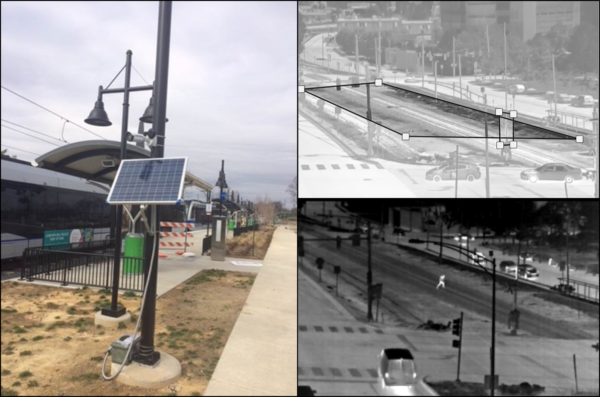
The selection of the study locations was informed by Amtrak train crew surveys, FRA incident data, and feedback from the NCDOT Rail Division staff. At least one week of 24/7 video data was collected in each seasonal quarter at each hot spot using static (fixed base) thermal video camera systems. AXIS thermal video camera systems with motion detection, remote data access, and local data storage were used (Exhibit 1). The video data were reduced by manual reviewing and coding attributes for each trespassing event, including time of day, duration, direction of travel, whether the trespasser is alone or in a group, group size, whether the trespasser crossed the tracks or traveled along the tracks, and basic information about the trespasser’s activity (walking, standing, sitting, laying). A notes field captured additional information not covered by the standardized fields, such as whether the trespasser was a child, riding or pushing a bicycle, walking a dog, carrying something, or anything else unusual or of note. Fundamentally, the final dataset provides a count of trespassing events for the data collection time periods and provides an estimate of the trespassing frequency at the hot spots.
Data collection occurred in two phases. The first pilot phase included five hot spot locations along the 174-mile-long North Carolina Railroad (NCRR) corridor from Raleigh to Charlotte, N.C. The second phase included six additional hot spot locations on the broader railroad network outside of the pilot corridor.
Preliminary analyses were completed for the first phase in early 2019, and analyses for the second phase was concluded in late 2020. Key preliminary findings for the pilot corridor included (Exhibit 2):
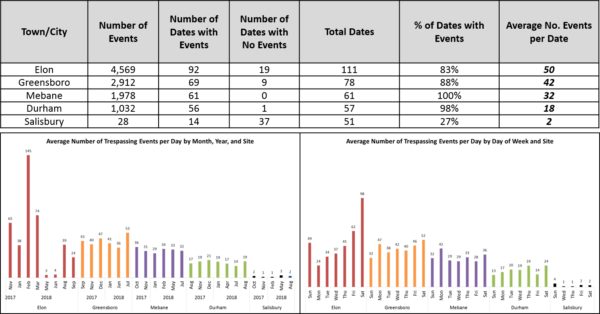
The magnitude of trespassing at hot spots along the corridor is much greater than indicated by FRA incident reporting and Amtrak train crew surveys. According to FRA statistics, 29 pedestrian rail trespass casualties (fatalities and injuries) occurred in North Carolina in 2018;
The majority of trespassing events are short in duration and involve crossing the tracks rather than movement along the ROW;
Variability in time-of-day/day-of-week/month-of-year patterns appear to be influenced by local environmental and population factors, such as the case of the study location adjacent to Elon University where university academic and athletic schedules appear correlated with trespassing activity; and
The profile of the average trespasser represented in the event-based data may not be consistent with the profile as defined with FRA incident data, particularly when analyzed at the local level rather than as a regional or state level aggregate.
The video train
The second component of the research involved the development of a train-mounted camera system for detecting trespassing activities and close-call events from a moving locomotive. Prototype machine learning algorithms also were developed using Aggregate Channel Features (ACF) detection to detect trespassing events.
Initially, a standard camera system interfaced with a Raspberry Pi and Arduino was tested that included the ability to overlap date, time, and GPS data onto the video in real time. However, the camera’s inability to detect in low light and darkness and the possibility of improving the detection algorithm using heat signatures led to the current system under testing. This system adapts the thermal cameras used for the hot spot (static) data collection for detection under dynamic conditions.
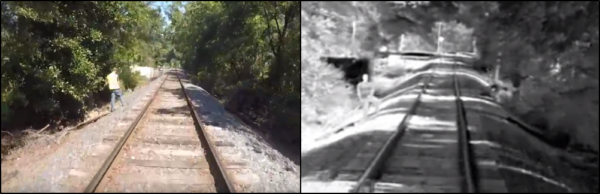
The system was tested in a variety of scenarios along a 2-mile rail corridor provided by Aberdeen Carolina and Western Railway Company (ACWRC) in Star, N.C. Standard video and thermal camera systems were setup on a hi-rail maintenance vehicle and were oriented forward and backward to capture staged pedestrian events in the front and rear of the vehicle as it approached. Scenarios were conducted that involved staged pedestrians walking parallel and perpendicular to the moving vehicle at a distance of 200 and 600 ft away from the vehicle. Exhibit 3 provides a snapshot from both camera views (standard and thermal) for one subject scenario of 32 possible scenarios. This test provided a rich video-based dataset to develop the machine-learning algorithms. A dataset was developed from the video collected during the scenarios to validate the pedestrian detection algorithms that are being developed.
Picking up pedestrians
The algorithm development process for detecting pedestrians involved four steps:
Defining the algorithm; creating the database;
training the algorithm; and testing the algorithm.
In step one, a region of interest was chosen in the camera field of view for the frame-by-frame object detection. Yellow boxes highlight a detected object and a confidence score defines the accuracy of the detection. Next, a database was developed from the videos collected in the first and second phase of hot spot data collection.
This database was determined to be unsuitable for dynamic video detection due to the need for different thermal shades of pedestrians in natural lighting, different pedestrian profiles, and different pedestrian scale lengths. Preliminary testing with this database revealed many false-positive detections assigned a high confidence level (i.e., non-pedestrian objects were assigned high confidence scores). To meet the need for appropriate thermal video samples to build a suitable database, the thermal camera system was mounted to a passenger vehicle and samples of naturalistic pedestrian activity were collected from sidewalks along Hillsborough Street adjacent to NC State University’s main campus.
A total of five hours of pedestrian data were collected during differing times of day between 07:30 to 09:30, 12:30 to 14:00, and 15:30 to 17:00 representing perpendicular and parallel paths as well as different walking gaits and arm movements. In the third step, Matlab was used for algorithm training. Matlab’s ACF object detector was trained using images of pedestrians extracted from the thermal video samples collected in the previous step. The ACF object detector learns to identify positive instances of objects such as pedestrians and negative instances of objects such as trees, cars, lampposts, etc., in images during the training.
Once the algorithm is trained, a variable or parameter is created. This parameter can be saved in .mat file format through Matlab. Once the .mat file is created, the database is not required, as all the necessary information will be stored in the file to be used in the future to detect pedestrians. In the final step, the trained algorithm was tested using the thermal video collected during the experiment in Star. Once the .mat file was created based on the imagery database, a code was written to import videos previously collected from the hi-rail setup in Star. The algorithm was overlaid onto this previously retrieved video to detect trespassers along the railroad ROW. The video was manually checked to determine if it was a true or false positive and recorded in a database by the research team for future analysis.
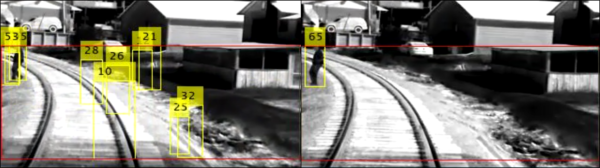
During the first test, a filter of 60% confidence was employed (Exhibit 4). When running the entire Star test track, a few false positives were detected. Additional measures to reduce false positives were explored, including modifying the region of interest into segments rather than a large frame of reference, allowing unnecessary regions to be excluded. This is useful to account for when a train goes around a curve, since the outer portion of the curve often includes areas with low pedestrian expectation.
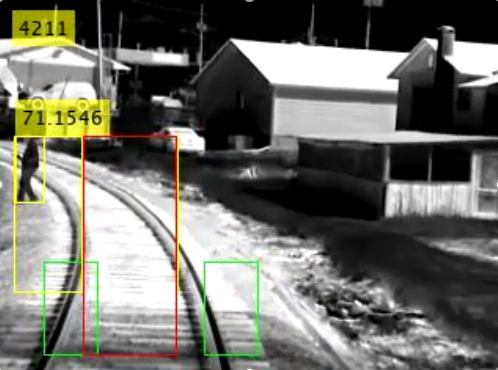
Exhibit 5 shows an example of how the region of interest can be configured so that two small lower boxes track the railheads to capture when the train is entering a curve and three upper boxes track the regions of interest. The two upper/outer boxes respond to curves by shrinking horizontally on the outside section of a curve. The algorithms developed showed a lot of promise, even with a very limited library of thermal imagery in its database. Additional imagery from more dynamic camera deployments also was being collected and processed to enhance the image database for improved training. Future research efforts include expanding the image database to continue to increase the confidence in the algorithm’s ability to capture pedestrian events. Even with such a limited database, the team was able to capture a significant number of events on its test track.
Summary and conclusions
The results of this research are useful at multiple levels. At the local level, data collected at the hot spot locations provided up-to-date information on the characteristics and frequency of trespassing events. This information can be used by local law enforcement and municipal officials to inform targeted educational initiatives and interventions to prevent trespassing by pedestrians along the railroad ROW, which will ultimately reduce injuries and deaths that may occur from these events.
At the state level, data-driven analyses that describe and estimate trespass events can be used to more accurately estimate costs related to strikes and near-strikes, including maintenance and delays, and to evaluate the effectiveness of safety programs by informing about when, where, and how trespassing events are taking place.
At the national level, this research provides a model for scientifically assessing pedestrian trespassing on the railroad ROW through the applied use of static and dynamic video detection technology. Overall, the methodology developed in the research can be applied outside of North Carolina to help meet the need for robust data and analyses of pedestrian trespassing in the U.S. and beyond. The data and information produced are important resources for educating colleagues, citizens, and public figures on the extent of trespassing along the railroad ROW and informing initiatives for reducing its occurrence.
Authors: Azhagan Avr, Daniel Coble, Chris Cunningham, Sarah Searcy, and Chris Vaughan.
Media
RELATED ARTICLES