Metra launches test of ridership dashboard
Written by Press Release
Work set to begin on Metra rail crossing replacement at 87th and Pulaski.
Metra
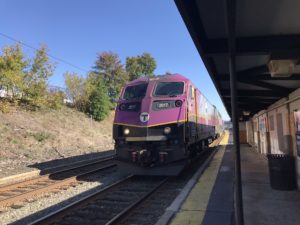
[Last week] Metra unveiled a test of a ridership dashboard that provides information to riders about how crowded trains have been on each line. The information will help riders who have the flexibility to travel at different times make data-driven decisions to select less crowded trains. The dashboard can be found at metrarail.com/dashboard.
“We hope this tool will help riders plan their travel according to their personal needs, as well as to encourage riders to shift to less congested trains, when possible,” said Metra CEO/Executive Director Jim Derwinski. “Giving our riders information to make informed decisions is another way we can help our riders ‘Commute with Confidence.”’
The dashboard indicates the average number of riders per train car over a five‐day period. The dashboard, which is being released as a test starting with weekday trains only, provides a view of the current schedule for each line, with each train highlighted in one of four different colors to indicate how crowded it was the prior week:
- Low Ridership, to be highlighted in green, will indicate an average of less than 50 riders per car on the train; riders can expect to find a seat at least one row from other riders.
- Some Ridership, to be highlighted in yellow, will indicate an average of 50-70 riders per car on the train; riders can expect to find a seat and not have another rider sitting next to them.
- Moderate Ridership, to be highlighted in orange, will indicate an average of 70-100 riders per car on the train; riders may have to stand to avoid sitting next to another rider. (When a train reaches this ridership threshold, Metra will add cars to the train or trains to the schedule if possible to create more opportunity for physical distancing.)
- High Ridership, to be highlighted in red, will indicate more than 100 riders per car on the train; limited space will be available, and riders may need to stand near other riders.
The dashboard will occasionally include trains highlighted in grey; this color will be used when schedule changes occur and Metra is collecting data for new trains, or if there are anomalies in the data for a particular train. It will take a week to collect data for trains that are new to a schedule. If you have any suggestions or other feedback about this tool, please send us an email at [email protected].
Media
RELATED ARTICLES