Rail Template Performance Evaluation
Written by Ulrich Spangenberg – Principal Investigator II Alexander Keylin – Principal Investigator, MxV Rail
MxV Rail
PUEBLO, Colo. - Ulrich Spangenberg, Principal Investigator II, and Alexander Keylin, Principal Investigator at MxV Rail write about rail template performance evaluation. This article appeared in Railway Track and Structures' August 2025 issue.
The performance of a given rail section is determined by the interaction between worn transverse wheel profiles and the transverse rail profile. Wear and rolling contact fatigue (RCF) performance are of particular interest to infrastructure owners because these factors can determine whether a rail needs to be replaced or maintained. Rail sections are manufactured and supplied with an as-rolled transverse rail profile. As the rail running surface wears, rail profiles may no longer provide adequate performance when contacting worn wheel profiles. Therefore, to improve performance throughout the rail’s service life, railroads develop and optimize rail profile templates that are applied by grinding. Persson et al.1 discusses an example of rail profile optimization to improve wear and RCF performance.
In past publications,2,3 rail profile templates from Class 1 railroads were assessed both statically and dynamically for their resistance to rail rollover. MxV Rail built upon these studies by analyzing the wear and RCF performance of the same open track rail grinding templates used by Class 1 railroads in North America. MxV Rail engineers assessed the performance of these rail profile templates to provide guidance to the industry on template profile designs that will ensure longer rail service lives. This work was performed under the Association of American Railroads’ (AAR) Strategic Research Initiative program.
METHOD
To assess the rail template performance in the current study of wear and RCF, NUCARS®1 simulations that used the same conditions as those used during the dynamic analysis of the rail rollover in the previous work were employed.3The conditions included the use of the following vehicle model: a loaded, covered hopper car with constant contact side bearings with a gross rail load of 286,000 pounds, as well as qualified M-9764 trucks in new condition. The measured worn wheel profiles used represented 0, 1, 2, 3, and 4 mm of hollow wear with a nominal 36-inch wheel diameter. Both the hollow worn wheel and its measured mate were used on all four axles within the car.
The chosen running speed of the vehicle was 25 mph, and three curvatures of three, six, and nine degrees were modeled, with a superelevation that resulted in a balance speed of 25 mph. Class 1 railroads typically apply the studied rail templates to track curvatures greater than or equal to three degrees, which means that multiple rail templates from different Class 1 railroads could be compared. The curve rail templates were anonymized and are referred to by a numeric value preceded by “R.” Three gage conditions were modeled, one with a narrow gage of 56.25 inches, one with a standard gage of 56.5 inches, and one with a wide gage of 57 inches. Dry wheel-rail contact conditions were also considered, with a maximum coefficient of friction of 0.5.
WEAR AND RCF ASSESSMENT METRICS
Two metrics were employed to evaluate the wear and RCF performance of the contacting wheel and rail profiles. The wear number, or Ty-value, was used to assess the wear performance, and the surface fatigue index (SFI),5 which is based on the exceedance of the shakedown limit, was used to assess the RCF performance. The creep forces, creepages, and contact areas for each contact occurrence on the rail profile were averaged over a 50-foot section of track during steady state curving. These average values were used to calculate both the wear number and the SFI that were used in the remaining analyses.
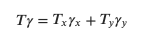
The wear number has been related to the material loss due to contact: the higher the number, the higher the expected material loss.6 The wear number is the sum of the product of the longitudinal and lateral creep forces (Tx, Ty) and the creepages (yx, yy). Equation 1 shows the wear number calculation. The sum of the wear numbers for all contacts across the rail profile pairs was calculated and used to compare the wear performance of the rail templates relative to one another. (1)
The SFI is a simple model in terms of its calculation requirements and its application. The working point or location of a given contact condition on the shakedown diagram is calculated based on its normalized vertical load and the traction ratio. The SFI is calculated as the horizontal distance from the working point to the shakedown limit by means of Equation 2. In Equation 2, πab is the area of the contact ellipse; k is the material’s yield strength in shear; and Fz is the normal force of the contact.
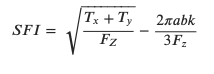
The value of k was selected as the yield strength in shear of intermediate strength rail with a value of 52.5 ksi. An SFI value greater than zero indicates that the initiation of RCF is likely. A distribution of SFI values was calculated for each rail profile template. Only the percentage of contact occurrences with an SFI value greater than 0.025 for each rail pair were considered. The value of 0.025 was chosen based on the bin sizes used to calculate the distribution of SFI values, with 0.025 being the first bin larger than zero. When analyzing the SFI, only contact conditions resulting in a traction ratio of less than 0.45 were considered, since it was assumed that any contact resulting in a traction ratio greater than 0.45 would wear away any RCF cracks.
RESULTS
Figure 1 shows the sum of the wear numbers and the percentage of SFI values above 0.025 for each rail profile pair. The shapes of the wear number and the SFI plots generally conform to one another. The best- and worst-performing rail profiles are indicated by the green and red ellipses, respectively. The rail profile pair R28 (highlighted by the yellow ellipse) had the second worst RCF performance while simultaneously having the second-best wear performance. The main causes of the best and worst performances of the rail templates were analyzed in more depth.
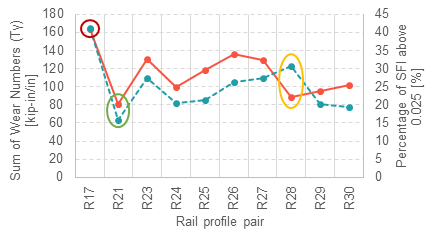
Figure 2 compares the high and low rail profiles of R17 and R21. The differences between the R17 and R21 rail profiles occurred mainly in the amount of gage shoulder relief of the high rail templates and the amount of field side relief of the low rail templates. Other characteristics that would distinguish the better-performing profile templates from those that performed poorly were sought.
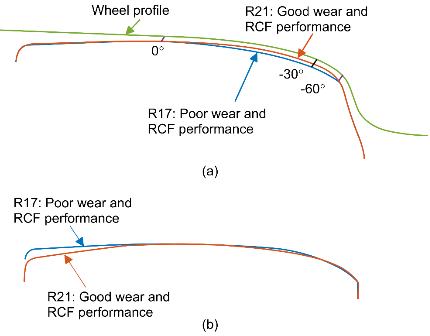
The rail crown radius and the conformity of the rail profiles to a given wheel profile were evaluated. The rail crown radius was calculated for a profile distance length of 0.787 inch (20 mm) centered around the midpoint of the rail profile. The conformity of the rail profiles shown in Figure 2(a) was calculated by aligning the wheel profile in two-point contact with the high rail profile (roughly between 0 degrees and -60 degrees) and calculating the distance from the wheel throat to the rail gage corner at a tangent angle of -30 degrees. When more than one wheel profile was assessed, the average value was considered.
The rail profile pairs were sorted from best to worst, left to right, based on their RCF performance. (Rail profile pair R28 was excluded from this comparison.) The crown radii of the high and low rails are shown in Figure 3, which also shows the conformity of the high rail profiles to both the unworn AAR-2A and the worn wheel profiles.
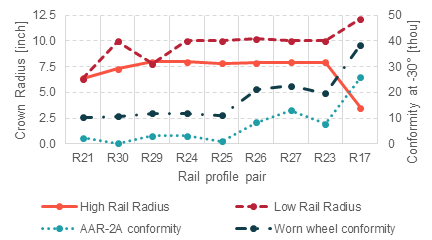
In general, except for the high rail crown radius of rail profile pair R17, the profile characteristic values increased as the RCF performance worsened. To achieve good RCF performance, the crown radius needs to be between 6 and 8 inches on the high rail and below 10 inches on the low rail. At the same time, the conformity to the unworn AAR-2A profile should be below 0.005 inch. The conformity of the rail profiles to the wheel profiles indicates the amount of gage shoulder relief present on the rail template. The conformity of the rail profiles to the unworn AAR-2A and worn wheel profiles were similar.
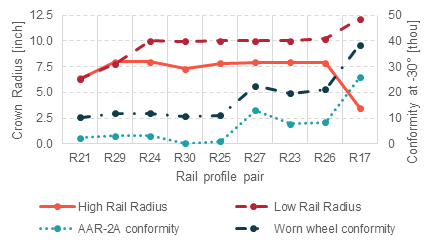
As Figure 1 illustrates, wear performance generally trends with RCF performance. The rail profile performance was sorted for its wear performance, which is shown in Figure 4. The overall shape of the graph will be similar, whether sorting the rail profiles for RCF or for wear; thus, the same observations that were made for RCF hold true for the wear performance.
CONCLUSIONS
This study determined the rail profile characteristics that best reduced wear and RCF. These characteristics could serve to inform rail maintenance staff or profile developers about how to prolong the rail’s service life and avoid associated costly rail replacement. The study of curve rail design templates that are applicable to curves with a curvature greater than or equal to three degrees showed that both better wear and RCF performance were achieved for:
- High rail profiles with less significant relief of the gage shoulder and gage corner and low rail profiles with relief on the field side.
- Crown radius of the high rail between 6 and 8 inches.
- Crown radius of the low rail 10 inches or less.
- Conformity of the high rail to the unworn AAR-2A profile less than 0.005 inch in addition to the requirement of the high rail crown radius.
REFERENCES
1. Persson, I., R. Nilsson, U. Bik, et al. 2010. Use of a genetic algorithm to improve the rail profile on Stockholm underground. Veh Syst Dyn; 48: 89–104.
2. Cummings, SM. 2020. Static Analysis of Rail Grinding Templates. Technology Digest, TD020-021. AAR/Transportation Technology Center, Inc. (TTCI): Pueblo, CO.
3. Cummings, SM and S. Gurule. 2020. Dynamic Analysis of Rail Grinding Templates. Technology Digest, TD020-022. AAR/TTCI: Pueblo, CO.
4. Association of American Railroads (AAR). 2024. Manual of Standards and Recommended Practices. Section D: Trucks and Truck Details. M-976, Truck Performance for Rail Cars. AAR: Washington, DC.
5. Ekberg, A., E. Kabo, and H. Andersson. 2002. An engineering model for prediction of rolling contact fatigue of railway wheels. Fatigue Fract Eng Mater Struct; 25: 899–910.
6. Tunna, J., J. Sinclair, and J. Perez. 2007. A review of wheel wear and rolling contact fatigue. Proc Inst Mech Eng Part F J Rail Rapid Transit; 221: 271–289.