Spike Fatigue Life Based on In-Track Load Measurements
Written by Principal Investigator I, Yin Gao Principal Investigator II, Yuqing Zeng
MxV Rail
PUEBLO, Colo. - From the February issue of Railway Track & Structures, Principal Investigator I Yin Gao and Principal Investigator II Yuqing Zeng write about evaluating spike fatigue.
Spike fatigue is just one example of the engineering challenges that railroads face while moving people and products across the continent. MxV Rail works with the railroading community to identify these issues and investigate potential mitigation strategies. We will provide updates on our efforts this coming April during the 30th Annual AAR Research Review. For details, please visit www.mxvrail.com/conference/30th-aar-annual-research-review.
Due to their ability to reduce gage widening as speed and axle load increase, elastic fasteners for timber and composite ties have gained popularity, and elastic fastening systems have been installed in many locations on North American heavy haul railroads. However, recent research has shown that when spikes have been used in conjunction with elastic fastening systems in territories with steep grades and high-degree curvatures, railroads have been experiencing a higher frequency of broken spikes.1,2
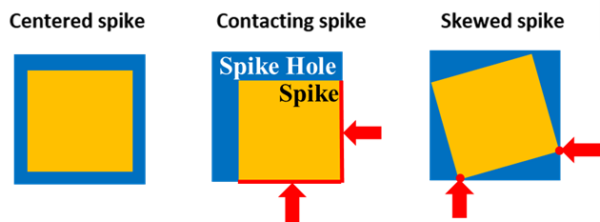
Recent numerical modeling1 has indicated that spike breakage appears to be a result of the combined effect of the lateral and longitudinal forces being transferred into the fastening system and generating high enough stress concentrations to produce fatigue cracks. The highest stress in the model occurred at the location where the fatigue failure initiated on an actual broken spike. The spike’s position in a spike hole can cause uneven load distribution in the spikes. As indicated in Figure 1, spikes can be oriented in a variety of positions in the tie plate spike holes. Due to uneven load distribution, one spike could carry more than 70 percent of the load transferred into the plate where that spike sits. Once the spike with the highest load breaks, the load will be transferred to another spike.
MxV Rail has been investigating the causes of and potential mitigations for broken spikes that can occur on curved track. A fatigue analysis used the measured spike load level under different conditions to estimate when spike breakage would occur. The stress cycle amplitude and cycle count for the spike fatigue analysis was calculated using a rainflow-counting algorithm. The analysis showed when the spikes theoretically could start to break and how to mitigate the broken spikes.
During testing, spikes instrumented with strain gages were developed and used in revenue service and at the Facility for Accelerated Service Testing (FAST®), Pueblo, CO, to measure the spike loading environment. The revenue service site featured trains of various weights and types to measure the spike load level based on train passage with a variety of axle loads, providing real-world loading environments for spikes. During the FAST test, instrumented spikes were installed on four commonly used wood tie fastening systems to measure the spike loading environment in all four systems.
In-Track Test
The revenue service testing was performed at a test site with a 9-degree, 25-minute curve with a 1.8 percent grade. The curve has three main tracks, each with a history of broken spikes. The track speed was 30 mph. The traffic included trains in both directions with various axle loads.
For the FAST test, engineers selected the following four test cases to represent four typical wood tie fastening systems:
- Case 1, elastic fasteners without rail anchors
- Case 2, elastic fasteners with rail anchors
- Case 3, curve block plates with rail anchors
- Case 4, American Railway Engineering and Maintenance-of-Way Association (AREMA) plates (traditional spike fasteners) with rail anchors
Case 1 had a history of broken spikes. Cases 2 and 3 had two potential remediation methods for broken spikes. Case 4 used standard AREMA plates that provided less rail roll resistance compared to the other fastening systems and were included for comparison. Instrumented spikes were installed only on the high-rail plates in each test case. Operating conditions at FAST were as follows:
- Six-degree curve with 0.2 percent grade
- Single track with train running clockwise and counterclockwise
- FAST train with three locomotives and 114 cars (most weighing approximately 315,000 pounds).
Spike Fatigue Life Analysis
Figure 2 depicts a representative spike load measured at the revenue service site where each wheelset corresponded with a small load cycle in the spike, and adjacent trucks formed a large cycle. Therefore, this spike underwent four small cycles and one large cycle for each car pass. The rainflow-counting algorithm was used to determine the number of fatigue cycles and stress amplitudes. This algorithm is often used in fatigue data analysis to reduce a spectrum of varying stresses into a set of simple stress reversals.
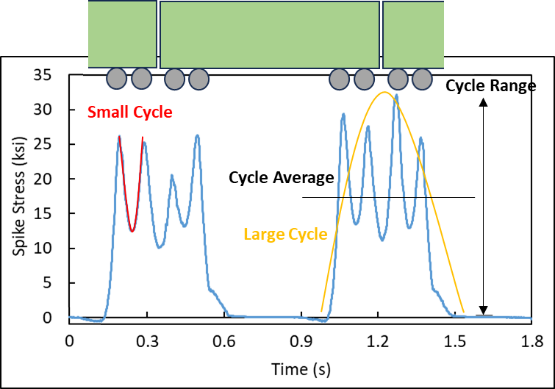
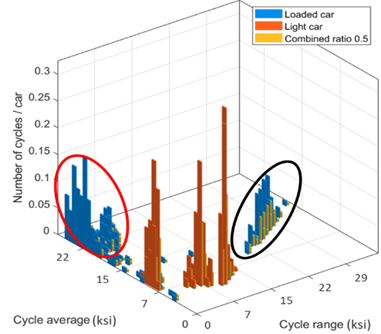
The stress cycle average and the stress amplitudes of spikes were extracted using rainflow counting (Figure 3). The stress cycle average is a way of quantifying the average stress in one cycle, and the cycle range assesses the peak-to-peak stress magnitude in one cycle (Figure 2). The blue bars and orange bars represent the loads created by loaded cars (axle load>25 kips) and light cars (axle load<25 kips), respectively. The yellow bars are load cycles generated by a certain ratio of loaded cars and light cars. In the figure, a combination ratio of 0.5 is shown. Typically, the area in the black circle of Figure 3 resulted from large cycles, and the area in the red circle came from small cycles. Both the cycle range and cycle average of the spike load induced by loaded cars were approximately three times higher than those induced by light cars. The number of cycles was normalized by car for further fatigue analysis. A typical stress-life cycle curve (S-N curve) for 1020 steel (spike material) was used in the fatigue analysis.3
The stress resultants from both the lateral and longitudinal directions comprised the spike stresses used in the fatigue analysis. For each test case in Table 1, the most heavily loaded spike among all the instrumented spikes was selected to calculate spike fatigue life. The spikes on elastic fastener plates presented a projected service life of only 65 million gross tons (MGT) under the heavy axle load environment. Rail anchors and curve block plates, when used as two remediations for spike breakage, extended the projected service life to both 320 MGT and 340 MGT at FAST, respectively. Based on the results analyzed from the revenue service test, light cars (<25-kip axle load) would not cause spike breakage. However, spikes under loaded cars (>25-kip axle load) only presented 35 MGT projected service life before starting to break. In addition, the fatigue analysis simulated an ideal condition where the total load transferred to a plate was evenly distributed to all the spikes on that plate. In this scenario, the spikes could last 600 MGT before the broken spikes start to occur.
Table 1. Spike fatigue life estimates for different test conditions
| Loading Environment | Fastener Type | Minimum Projected Spike Fatigue Life |
| FAST elastic fastener | No rail anchor | 65 MGT |
| FAST elastic fastener | Rail anchor | 320 MGT |
| FAST curve block | Rail anchor | 340 MGT |
| FAST AREMA plates | Rail anchor | 870 MGT |
| Revenue service elastic fastener – actual traffic | No rail anchor | 66 MGT |
| Revenue service elastic fastener – loaded car only | No rail anchor | 35 MGT |
| Revenue service elastic fastener – light car only | No rail anchor | Infinite spike life |
| Revenue service elastic fastener – loaded car only, evenly distributed spike stress | No rail anchor | 600 MGT |
Conclusions
The spike loading environment was measured using instrumented spikes both at FAST and in revenue service. The spike stress data was analyzed using the rainflow-counting algorithm to calculate the stress cycle range, average, and count. A fatigue analysis was then performed to assess the spike fatigue life for different fastening systems and different axle load levels. The analysis provided the following information:
- Analysis from both FAST and revenue service tests projected that spikes on elastic fastener plates with no rail anchors would start to experience fatigue failures within 65 MGT under loaded traffic.
- Based on the spike data collected in revenue service, only loaded cars generated spike breakage. Light cars presented an infinite spike life. As long as there is heavy car traffic (>25-kip axle load) in a high-grade and high-degree curve, spikes on elastic fasteners will likely experience some fatigue failures.
- Two mitigation methods (rail anchors and curve block plates) could extend spike life but neither presents a permanent fix for the spike breakage issue.
- Even distribution of the spike load could significantly increase the spike fatigue life (35 MGT to 600 MGT). Methods that generate an even distribution of loads among all spikes may provide a potential solution for broken spikes and should be evaluated.
References
- Gao, Y., M. McHenry, and B. Kerchof. 2018. “Investigation of Broken Cut Spikes on Elastic Fastener Tie Plates Using an Integrated Simulation Method.” Proceedings from 2018 ASME/IEEE Joint Railroad Conference, April 18–20, 2018, Pittsburgh, PA, USA.
- Gao, Y. 2022. “Spike Loading Environment in Various Wood Tie Fastening Systems.” Technology Digest TD22-016. Association of American Railroads (AAR)/MxV Rail: Pueblo, CO.
- American Society of Mechanical Engineers (ASME). 1998. BPV Code, Section 8, Div 2, Table 5-110.1.