What if? Norfolk Southern develops effective UAV program, but it did not come without some trial and error
Written by RT&S Staff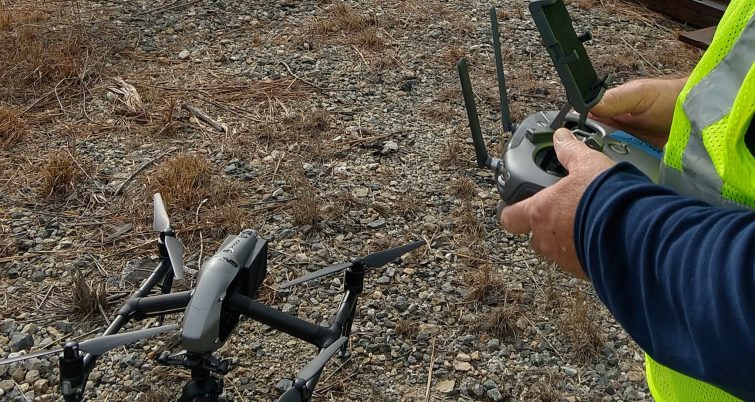
Norfolk Southern
As the rail industry continues its drive towards lower operating costs, engineering departments are looking at ways to provide more bang for the buck. At Norfolk Southern Railway, the Engineering Department is tackling this challenge by applying technology to improve existing processes. They targeted one crucial process in particular, the infrastructure design process, and explored opportunities to use “new” technological resources to reduce the time and financial resource requirements traditionally required.
The following is the NS story.
The entire program started out as a “what if?”
What if we could use lower-cost UAVs (drones) to take perspective shots of troubling project areas, and share them with our project team in the office? That would more than pay for itself, cut some travel costs and provide additional situation awareness that could make the difference in detailed portions of the design.
In the end, the current capabilities of UAV-derived photogrammetry data are very impressive in the right circumstances, and when properly planned.
Our next thought was then, “what if these photos can be stitched together to get an updated Google Earth aerial, or mosaic, for the project?” With that, the 50+ designers and project partners on our team can obtain an even better situational awareness of the entire area from their remote offices, even further cutting down our resource allocations. Well, that’s getting a little more advanced.
And finally, what if this big mosaic can add a third dimension–elevations? Elevations that we could use to ultimately design and build an entire 5-mile-long project off of, and be confident in doing so.
That was the challenge.
After doing some research, we found that our thoughts were not novel. As we looked into the idea further, we found other industries were experimenting and utilizing drones to derive elevation (design) data through photogrammetry software. That’s when our mission became clear: To find out if we could generate 5 miles of survey grade data, and then use the data to prepare construction drawings, with just our entry-level drones and photogrammetry software. And then our journey started.
As we got our field UAV team together to fly our linear test project, the only prerequisites were a commercial drone license (Part 107) and the desire to figure out something new. The linear project was approximately 5 miles in total length, and posed several challenges:
Approximately 30 percent of the project was wooded;
Large variations in terrain elevation across the project;
Rivers, creeks, and potential wetlands bounded our project from all sides;
Replacement of a single span bridge to accommodate another parallel track; and
Replacement or extension of more than 20 culverts.
All of the challenges, we would learn, would test the limits of photogrammetry, our wits, and sometimes our patience.
Experiencing growing pains
Starting out our ambitious first flight, we wanted to maximize our results.
We were going to fly the least amount of total flights and cover the largest amount of area. We thought that if we could fly the entire project, the photogrammetry software would use its magical computer vision algorithms to make it work for us. And not only would the magical software mesh everything together, but it would give us survey-grade data in 5 percent of the time of a traditional survey, revolutionizing our infrastructure design process.
Well, when we started processing the data of that first flight, we found out we were wrong.
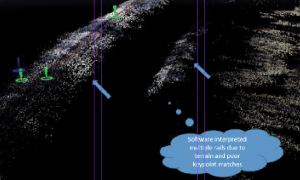
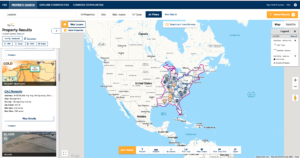
Figure 1. Screenshot of Pix4D software, showing initial busts in photogrammetry data without a defined plan.
After spending several days trying to make the software make sense of the photos, we ended up with an unusable result. Data points that should be in the same vicinity were up to 36.5 ft apart horizontally, and up to 80 ft off vertically. The existing track seemed to be ramping up into the heavens in some areas for no apparent reason. In the end, over 50 percent of the pictures that the drone took were unusable. This was not going to work.
A second chance
The one great thing we had going for us was that we had a great team. One of those great team members is Michael Allen, who has over 25 years of survey experience in the field, and used that experience to guide how we would get better results the next time. Based on his experience and online research, he developed a plan for our next attempt that we stuck to while out in the field. That plan worked a lot better.
After the second attempt, we realized survey grade accuracy (0.15 ft variance from traditional GPS/total station survey) within 25 ft of the existing rail, as well as for the track centerline. In light vegetation, results were not as favorable, being about 0.3 ft off from the traditional survey on average. But in dense vegetation we experienced our worst results, with an average variance of 6.8 ft from traditional survey data.
Although we were not able to get survey-grade data across the entire project, our revised strategy ended up giving us much more accurate data and gave us best practices to go by on future projects.
Six to follow
After looking back at our hard-earned lessons, we developed six rules to follow on UAV-derived photogrammetry projects. All of which we follow on our flights to this day.
Using multiple flight plans–As a rule of thumb, the more pictures for an area, the better. When the software has more pictures, it can see common points and items from different angles, and intelligently make decisions about what to include and exclude in the results.
Use both oblique and NADIR camera angles–The more angles the software has of a single point, the more intelligently it can refine the xyz coordinates of it. Using two camera angles per flight area, and a double-grid pattern for each mission, provides the additional data the software needs for the computer vision algorithms to work.
Set five (5) Ground Control Points (GCPs) per flight envelope—We learned the photogrammetry software could better stitch together all images of a flight if there are two GCPs at the beginning, one in the middle, and two at the end.
Overlap the flight envelopes—The two GCPs at the end (from rule No. 3) are included in the overlap of the next mission. This provides hard-coordinate xyz commonality between separate flights. We like to have at least a 10-15 percent overlap between missions.
Overfly the desired survey area—Flight plans were usually flown at least 60 ft to 100 ft beyond the desired survey area. This mitigates the stretch and warp common at the edges of a photogrammetric-based 3-D model, and ensures we get all of the data we need.
Invest more time in manually processing data—By investing the time to manually filter out the bad data from good data, there is ultimately a better and more accurate end product that can be provided to design engineers.
Even more importantly, we learned what does not work well when attempting to derive survey-grade data from UAVs:
Do not try to map areas with heavy vegetation and hilly terrain—The randomness of heavily vegetated areas and lack of key point matches makes creating an accurate 3-D model nearly impossible. With no common reference points, the software will exclude these images from the initial processing stage, creating large gaps in the data.
Do not place GCPs in areas with a medium to heavy vegetation canopy—If the camera can’t clearly see a GCP, it can’t use it. It is better to select flat, non-vegetated areas for GCPs, which gives the photogrammetry software more confidence during processing.
Do not fly too high—Flying projects 300 ft to 400 ft above ground level is faster due to fewer images having to be taken, but fewer images are taken overall. And those images that are taken are less detailed, and produce lower quality data for processing.
Do not have a low-powered computer—Without software-recommended computer specs, the processing time may cancel out the time savings of photogrammetry that would be otherwise realized. Our project required 20 GB of hard drive space per mile.
What they can deliver
No track time needed
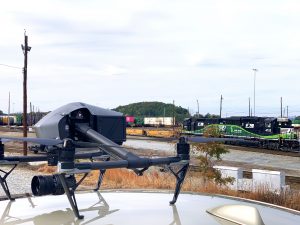
To collect survey data within the foul of the track, traditional surveys utilizing GPS and/or multi-station setups require track protection to complete. With UAV-based data collection, the pilot and observers can be situated “in the clear” for the entirety of the survey. This is a big financial and safety benefit over traditional methods, as it allows uninterrupted train operations and avoids costly wait times when the two- to three-person survey crews wait on track protection.
Lower labor and equipment costs
Overall, deliverables for the UAV-derived photogrammetry required almost 1/3 of the man-hours it would take to complete with traditional methods, at around 1/2 the equipment costs. One important caveat is that the UAV-derived photogrammetry data was not reliable for areas with medium to heavy tree canopies, which the traditional survey was able to collect. In less than ideal terrain, those savings with photogrammetry are somewhat misleading.
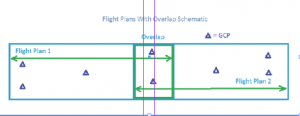
Figure 2. Suggested overlap pattern and Ground Control Point (GCP) spacing for photogrammetry flights on linear projects.
A more detailed representation of existing topography changes
With traditional surveying methods, terrain is surveyed in a 50-ft x 50-ft grid or 100-ft x 100-ft grid pattern, along with ridgelines, major grade changes, etc. This generates a minimum of four points, along with anywhere from five to 20 points to account for those features.
With UAV-derived photogrammetry methods, the software processes the aerial imagery and generates anywhere from 2,000 to 4,000 data points within that same area. Providing more than 100 times the amount of data, UAV-derived photogrammetry is much more “sensitive” to changes in topography.
Several benefits that could be realized from a higher density of data are:
More precisely developing earthwork quantities, aiding in tighter project budgeting;
Obtaining exact critical structural catch points over large projects;
Providing attractive and detailed media for planning and presentations;
Potentially more agreeable pay item quantities if the project is flown with UAV photogrammetry throughout the different phases of construction.
In the end, the current capabilities of UAV-derived photogrammetry data are very impressive in the right circumstances, and when properly planned. Tremendous quantities of data can now be derived from photographs that would just be used for presentations or visual reference in the past.
However, traditional surveying methods are still needed on areas where UAVs cannot adequately capture the necessary information.
If the camera cannot see the point (and preferably from multiple angles), you won’t get good data. LiDAR, another technology for aerial surveying, is available for those situations, but is substantially more expensive at this time. When properly planned, a linear infrastructure project using an optimal balance of photogrammetry technology and traditional surveying techniques can generate a complete representation of the project site at a fraction of traditional surveying costs, and in much less time.
In the future, our team believes that with better computer-vision algorithms and a more user-friendly interface, photogrammetry can provide project owners a comprehensive design-grade representation of existing site conditions at earlier stages of capital-intensive projects.
This can provide a more confident estimation of project costs, and will likely lead to higher ROIs for owners. Additionally, construction contractors and vendors supporting those projects can utilize the data to substantiate and be more confident in the design, intermediate, and as-built quantities that they provide to project owners.
Special thanks to the NSR D&C Department, and our valuable Engineering Service Provider team members. Everyone on the team made this possible.
Use cases for photogrammetry go far beyond infrastructure design, which could lead to more efficient operations and safety improvements across railroad engineering and maintenance.
If you are looking to exchange ideas or collaborate on this new frontier, feel free to reach out to Matt Williams ([email protected]) and/or Michael Allen ([email protected]) in Norfolk Southern’s Design and Construction Department.